
Even though it never happens, we're all almost fed up with the fact that the UK has actually been having a summer this year - people are complaining that it's too hot, and that there's nowhere to go to escape from the heat.
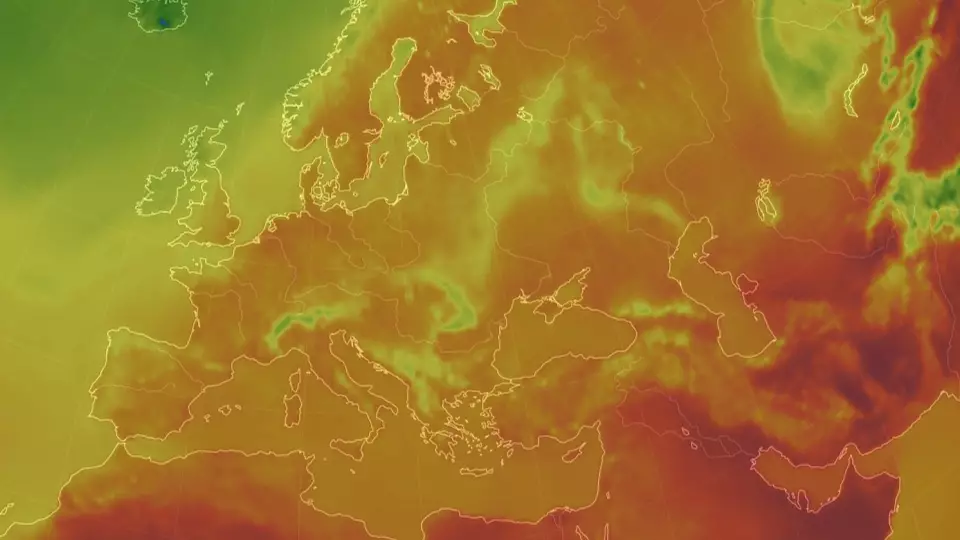
Judging from this new online interactive map, that's quite literally the case. Pulling together a whole bunch of data from the likes of the Global Forecast System (GFS) and the National and Atmospheric Administration (NOAA), the map shows users exactly how warm it is at any given point right now on the Earth.
Updating temperature readings every three hours, is colour-coded so you can see just how hot it is across the entire globe at once, and realise that actually, while it's definitely hot, there are plenty of other cities and countries who have it much, much worse right now.
For example, while temperatures reached a staggering 33°C in the UK this week, parts of Southern California have hit 38°C and in Saudi Arabia temperatures of 46°C have been recorded. Which isn't particularly surprising, but still - it makes you think.
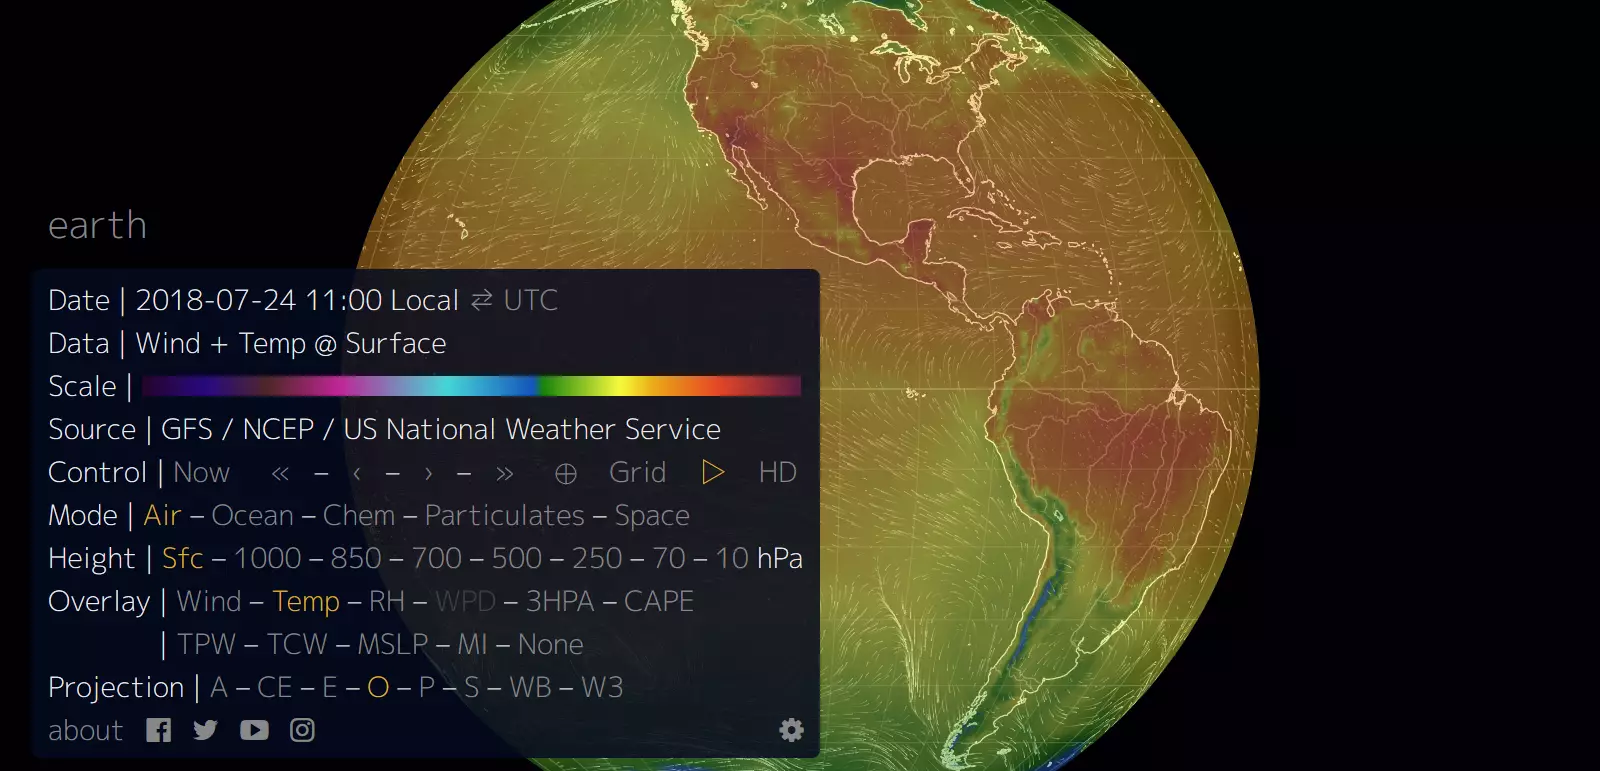
Temperature is not the only thing the interactive map can show, either - while its interface is a little complex and doesn't seem to come with any guide as to how to use it quickly, users can also toggle the settings to see wind speeds, relative humidity and surface and ocean temperatures.
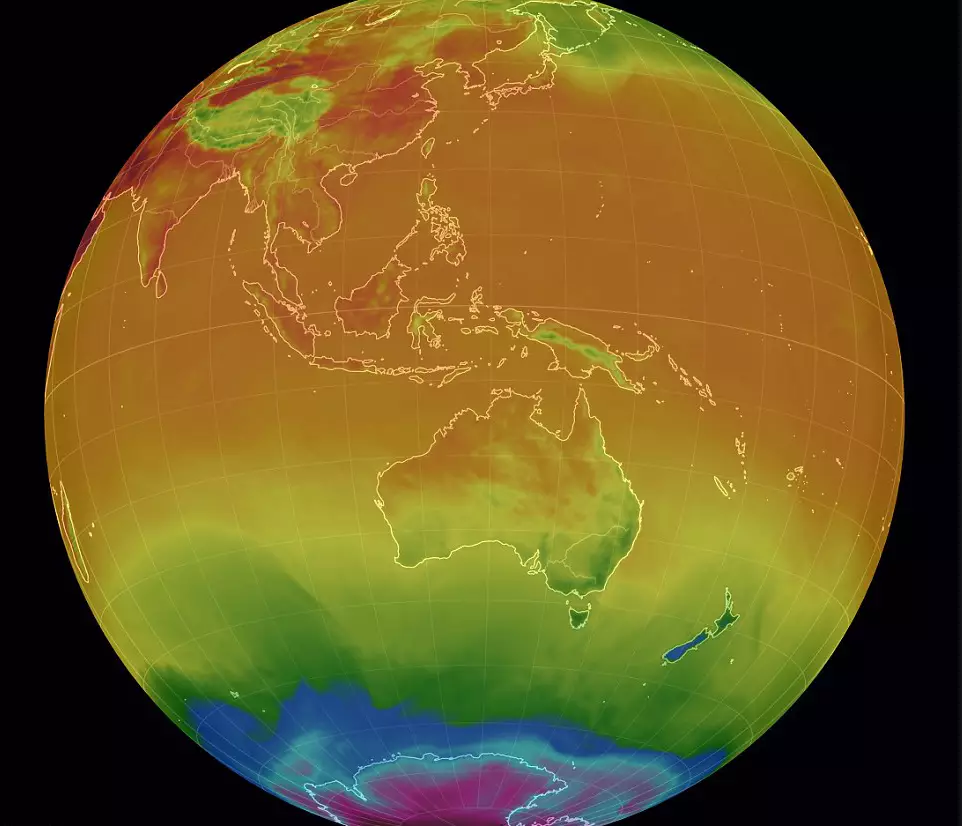
While you can look at the entire globe to get an overall sense of the relativity of temperatures while watching air patterns move just like they do on the weather forecasts after the news, you can also click on a specific point to get exact readings for that location.
It can also track the movements of the aurora borealis, which is good news for anyone trying to see the Northern Lights. Which is something everyone should see at least once in their lifetime. Apparently.
Anyway, back to the issue of heatwaves, it seems there's also no end in sight - literally, if you're looking at this map - and that, thanks to persistent high pressures, it could well continue until the end of August. By which point people really will be fed up with it and pining for the UK's usually grey and glum skies.
Featured Image Credit: earth.nullschool.netTopics: Weather, News, Technology, Sun